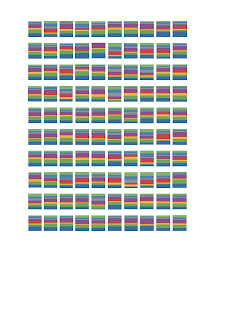
I input the data from my sensory taste tests and produced the following stack and bar charts.
I input the data from my taste tests into Numbers on iWorks. I thought these could look quite intriguing if I were to use only the stack, so I cropped them out and positioned them together.
I thought these may look better closer together, so I played around with the spacing....
&in my opinion...yes they do!


No comments:
Post a Comment