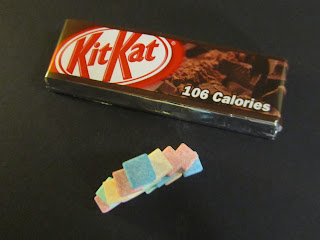
I began to consider how I could visually represent the data and statistics in an alternative manor to digitally based work I usually produce. I stacked the cubed sweets to represent the amount of sugar in the KitKat and also for the amount of fat, sugar, calories and saturates.
I also experimented in doing this with some of their flavours.....
From the KitKat flavours I researched I then produced these.....
Peanut Butter KitKat
Herbal Tea KitKat (available in Japan)
I really like this style of working as I think it engages with the audience considerably well. However, I would need to consider how the information would be easily conveyed to my audience if I were to use this.


No comments:
Post a Comment